Healthcare UX · Case Study

Individual Patient
Overview 2.0

Redesigning a clinical data platform used across Swedish cancer care, making it diagnosis-independent, role-aware, and scalable without adding cognitive overhead.

UX Research Service Design Effect Mapping Flow Mapping Wireframing Prototyping User Testing
Organisation
Regionalt Cancercentrum
My Role
UX Designer
Collaborators
Product owners · Developers · Healthcare professionals · Clinical coordinators
Tools
Figma · Miro · FigJam

A research-first approach built for clinical complexity

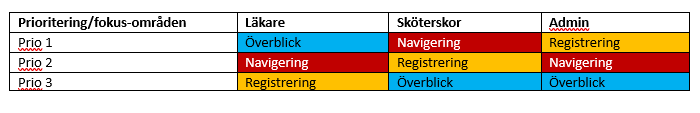
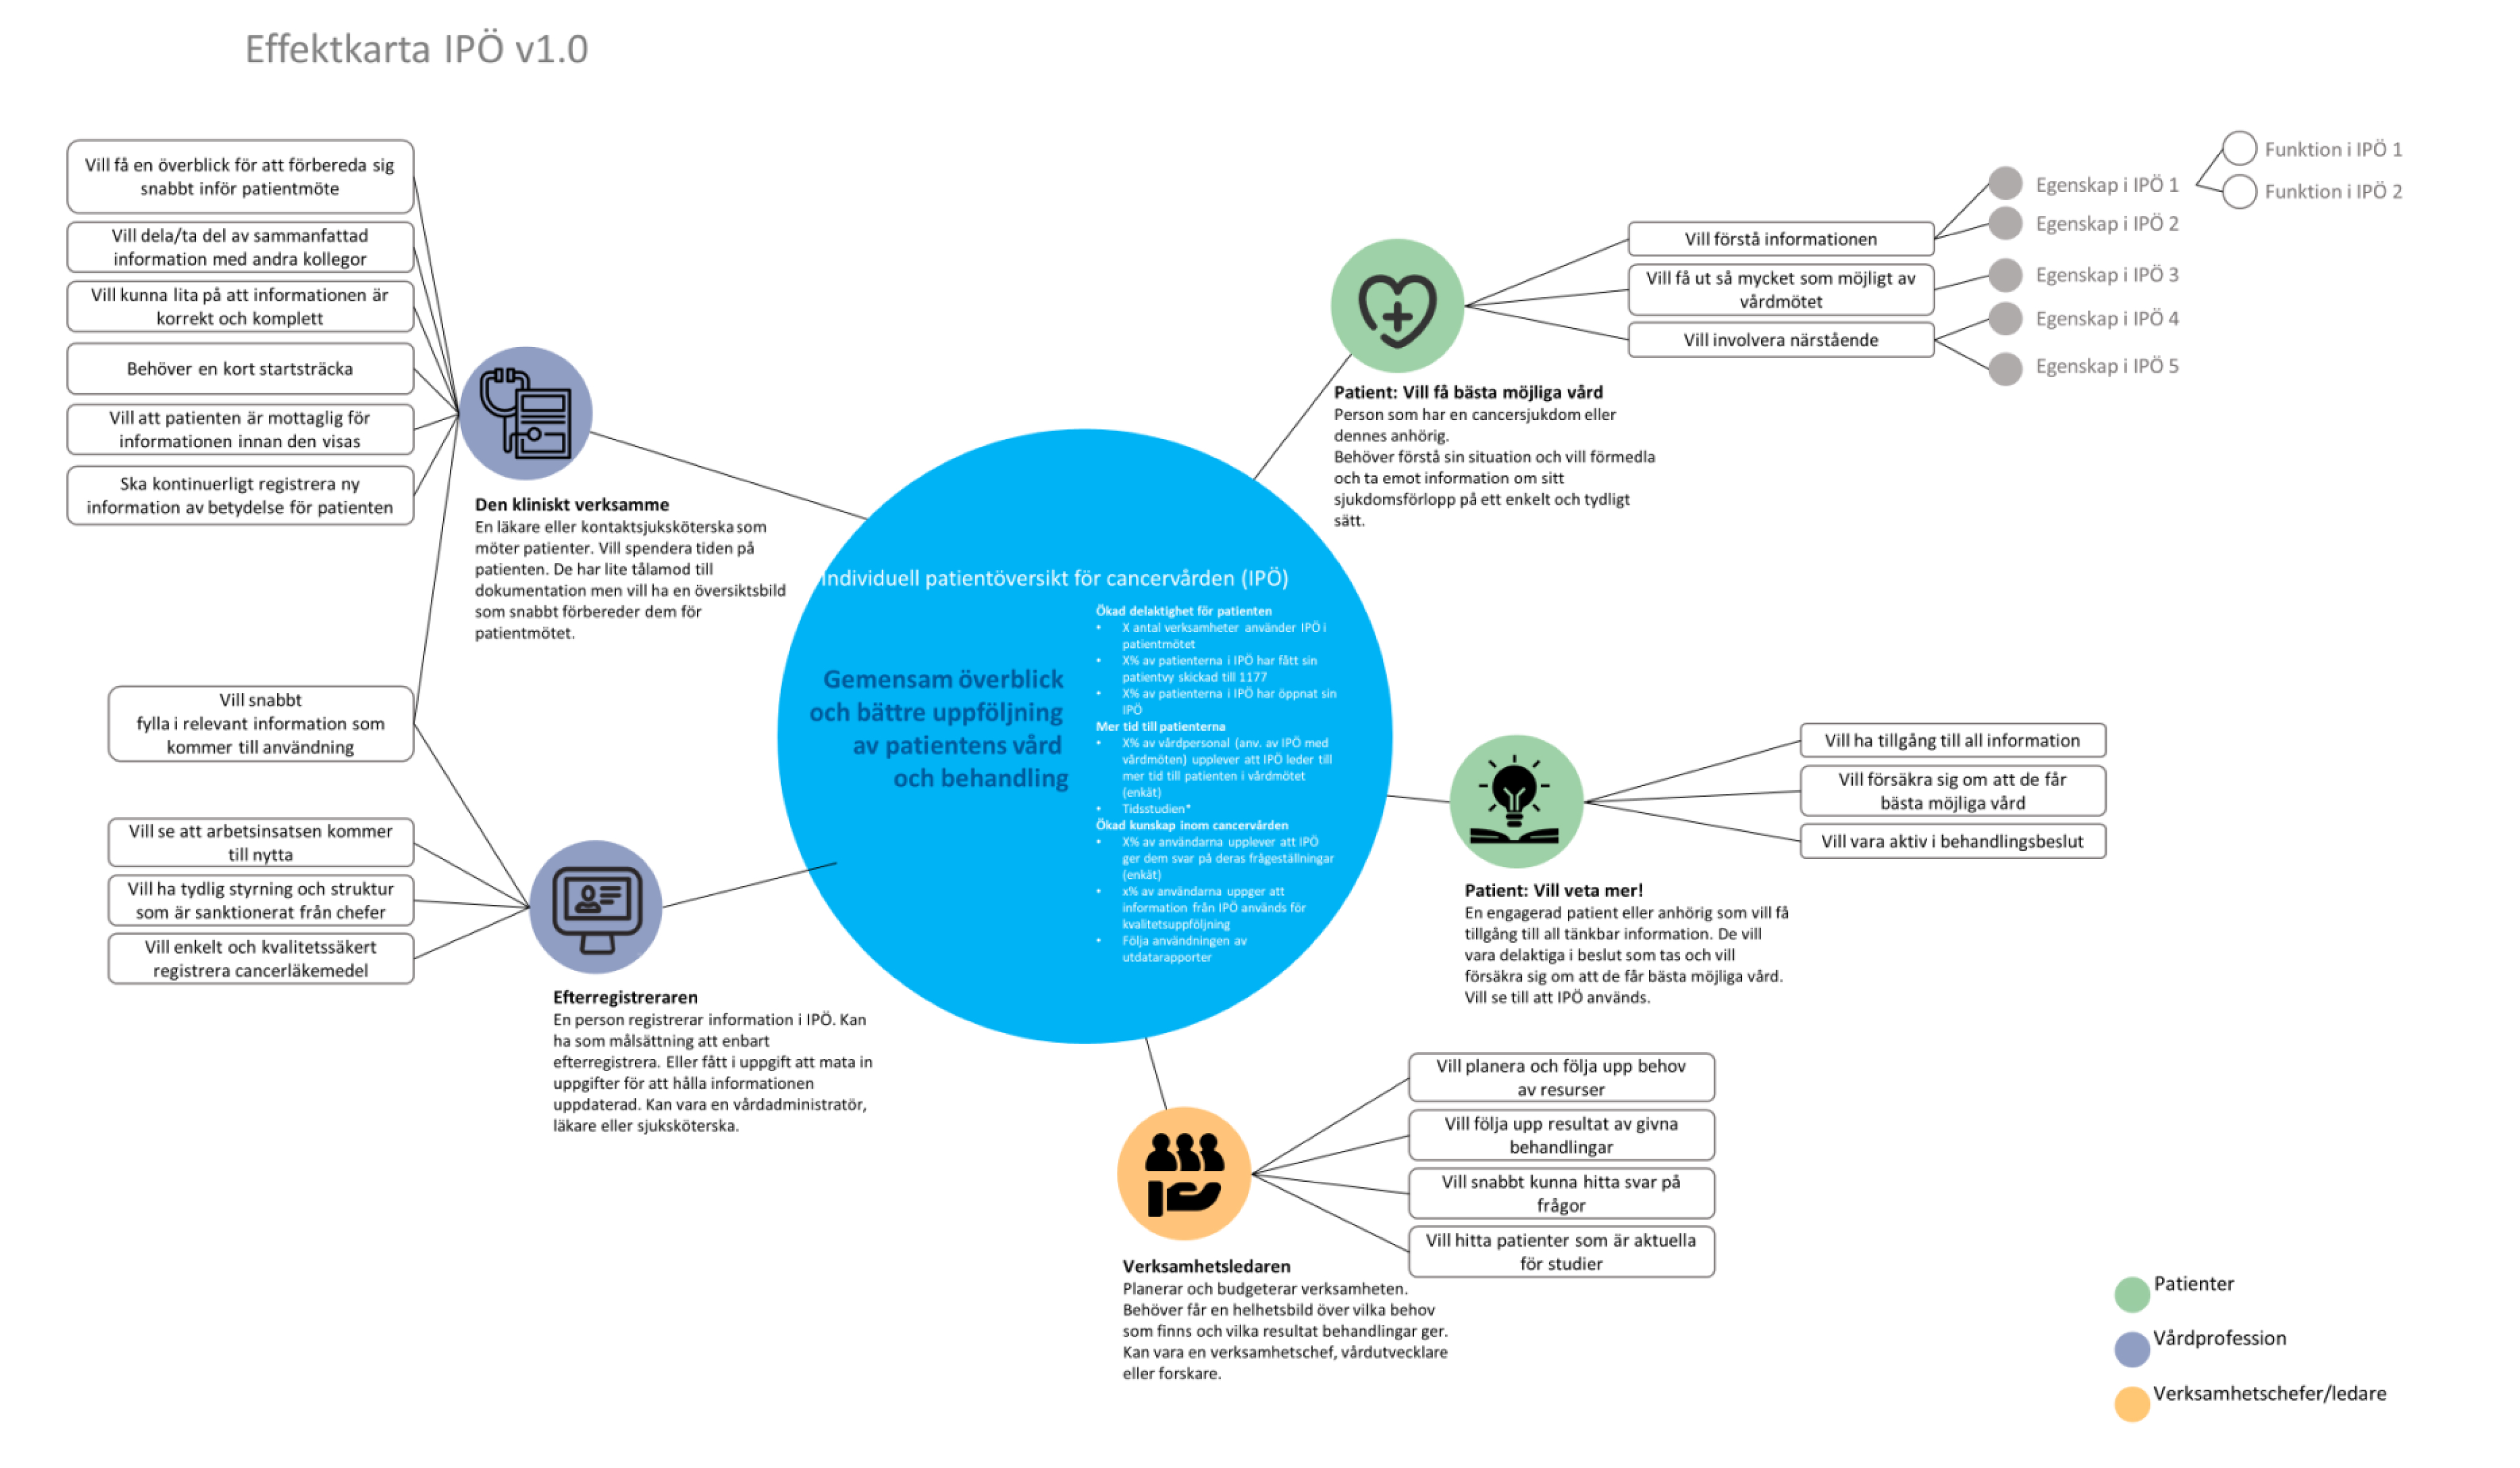
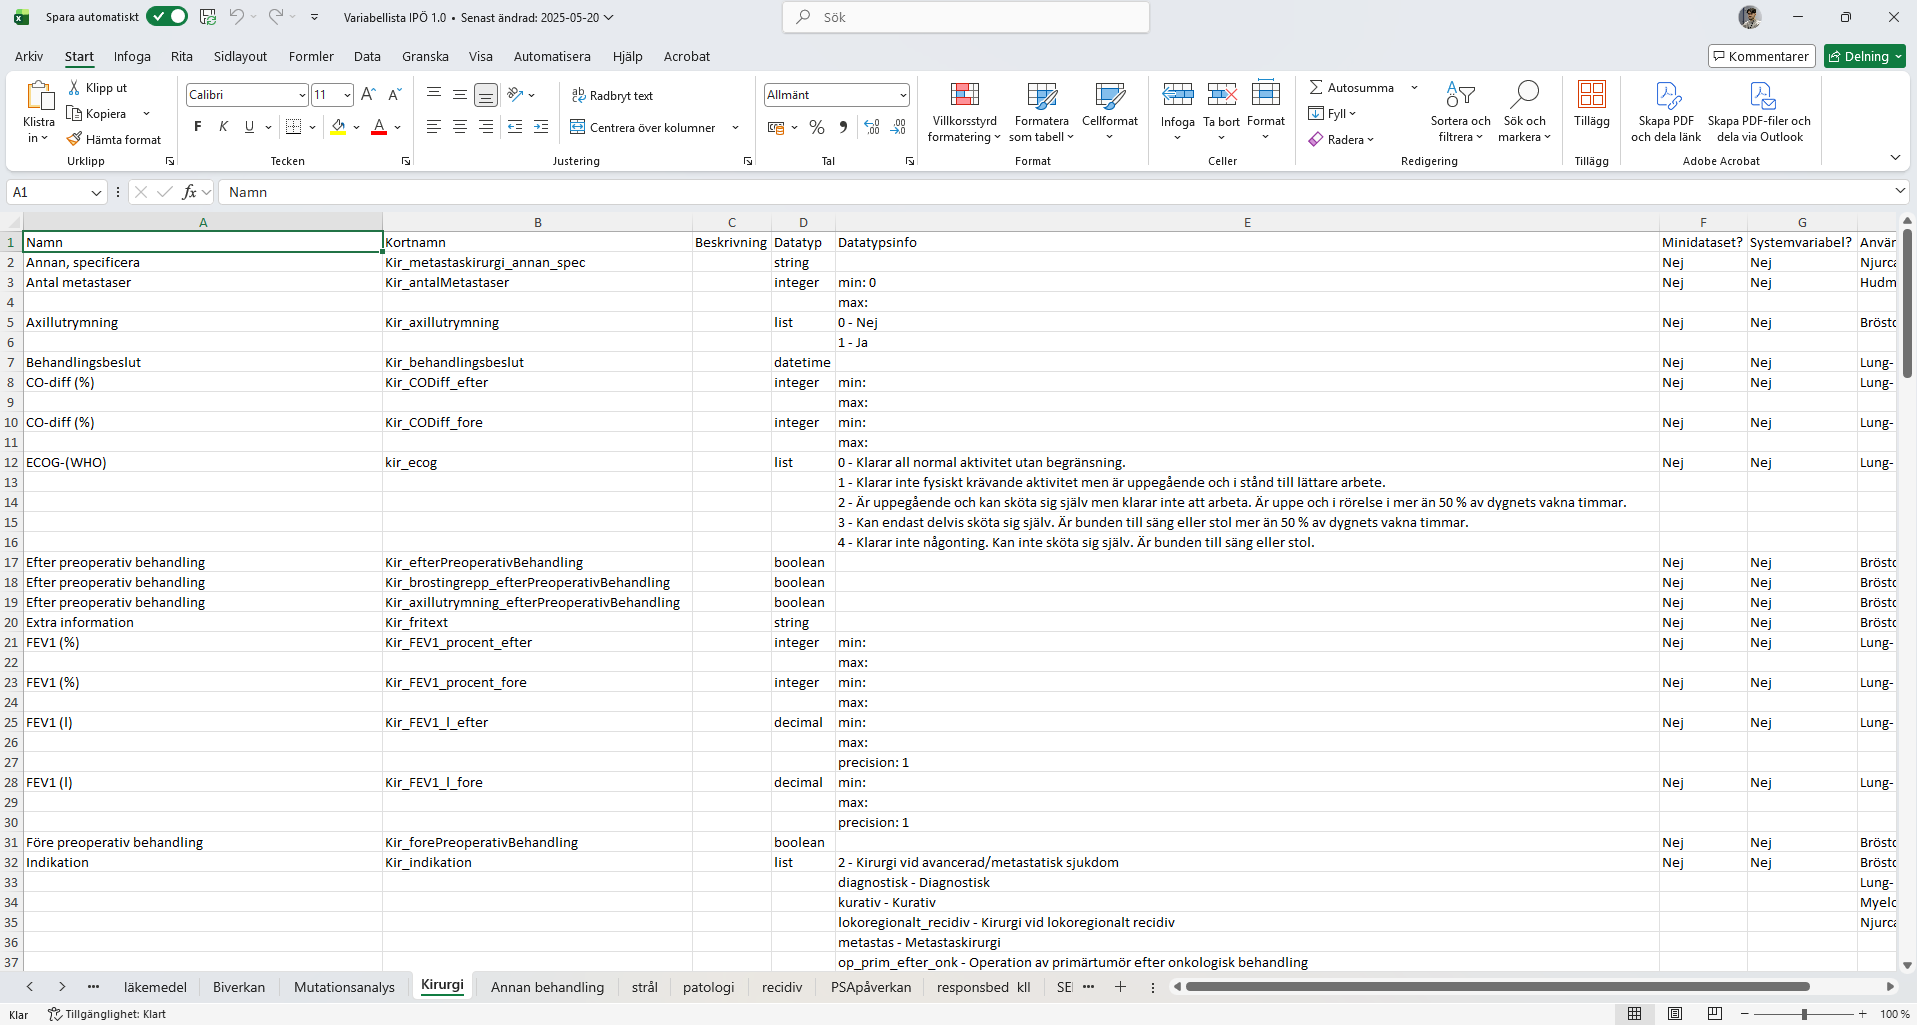
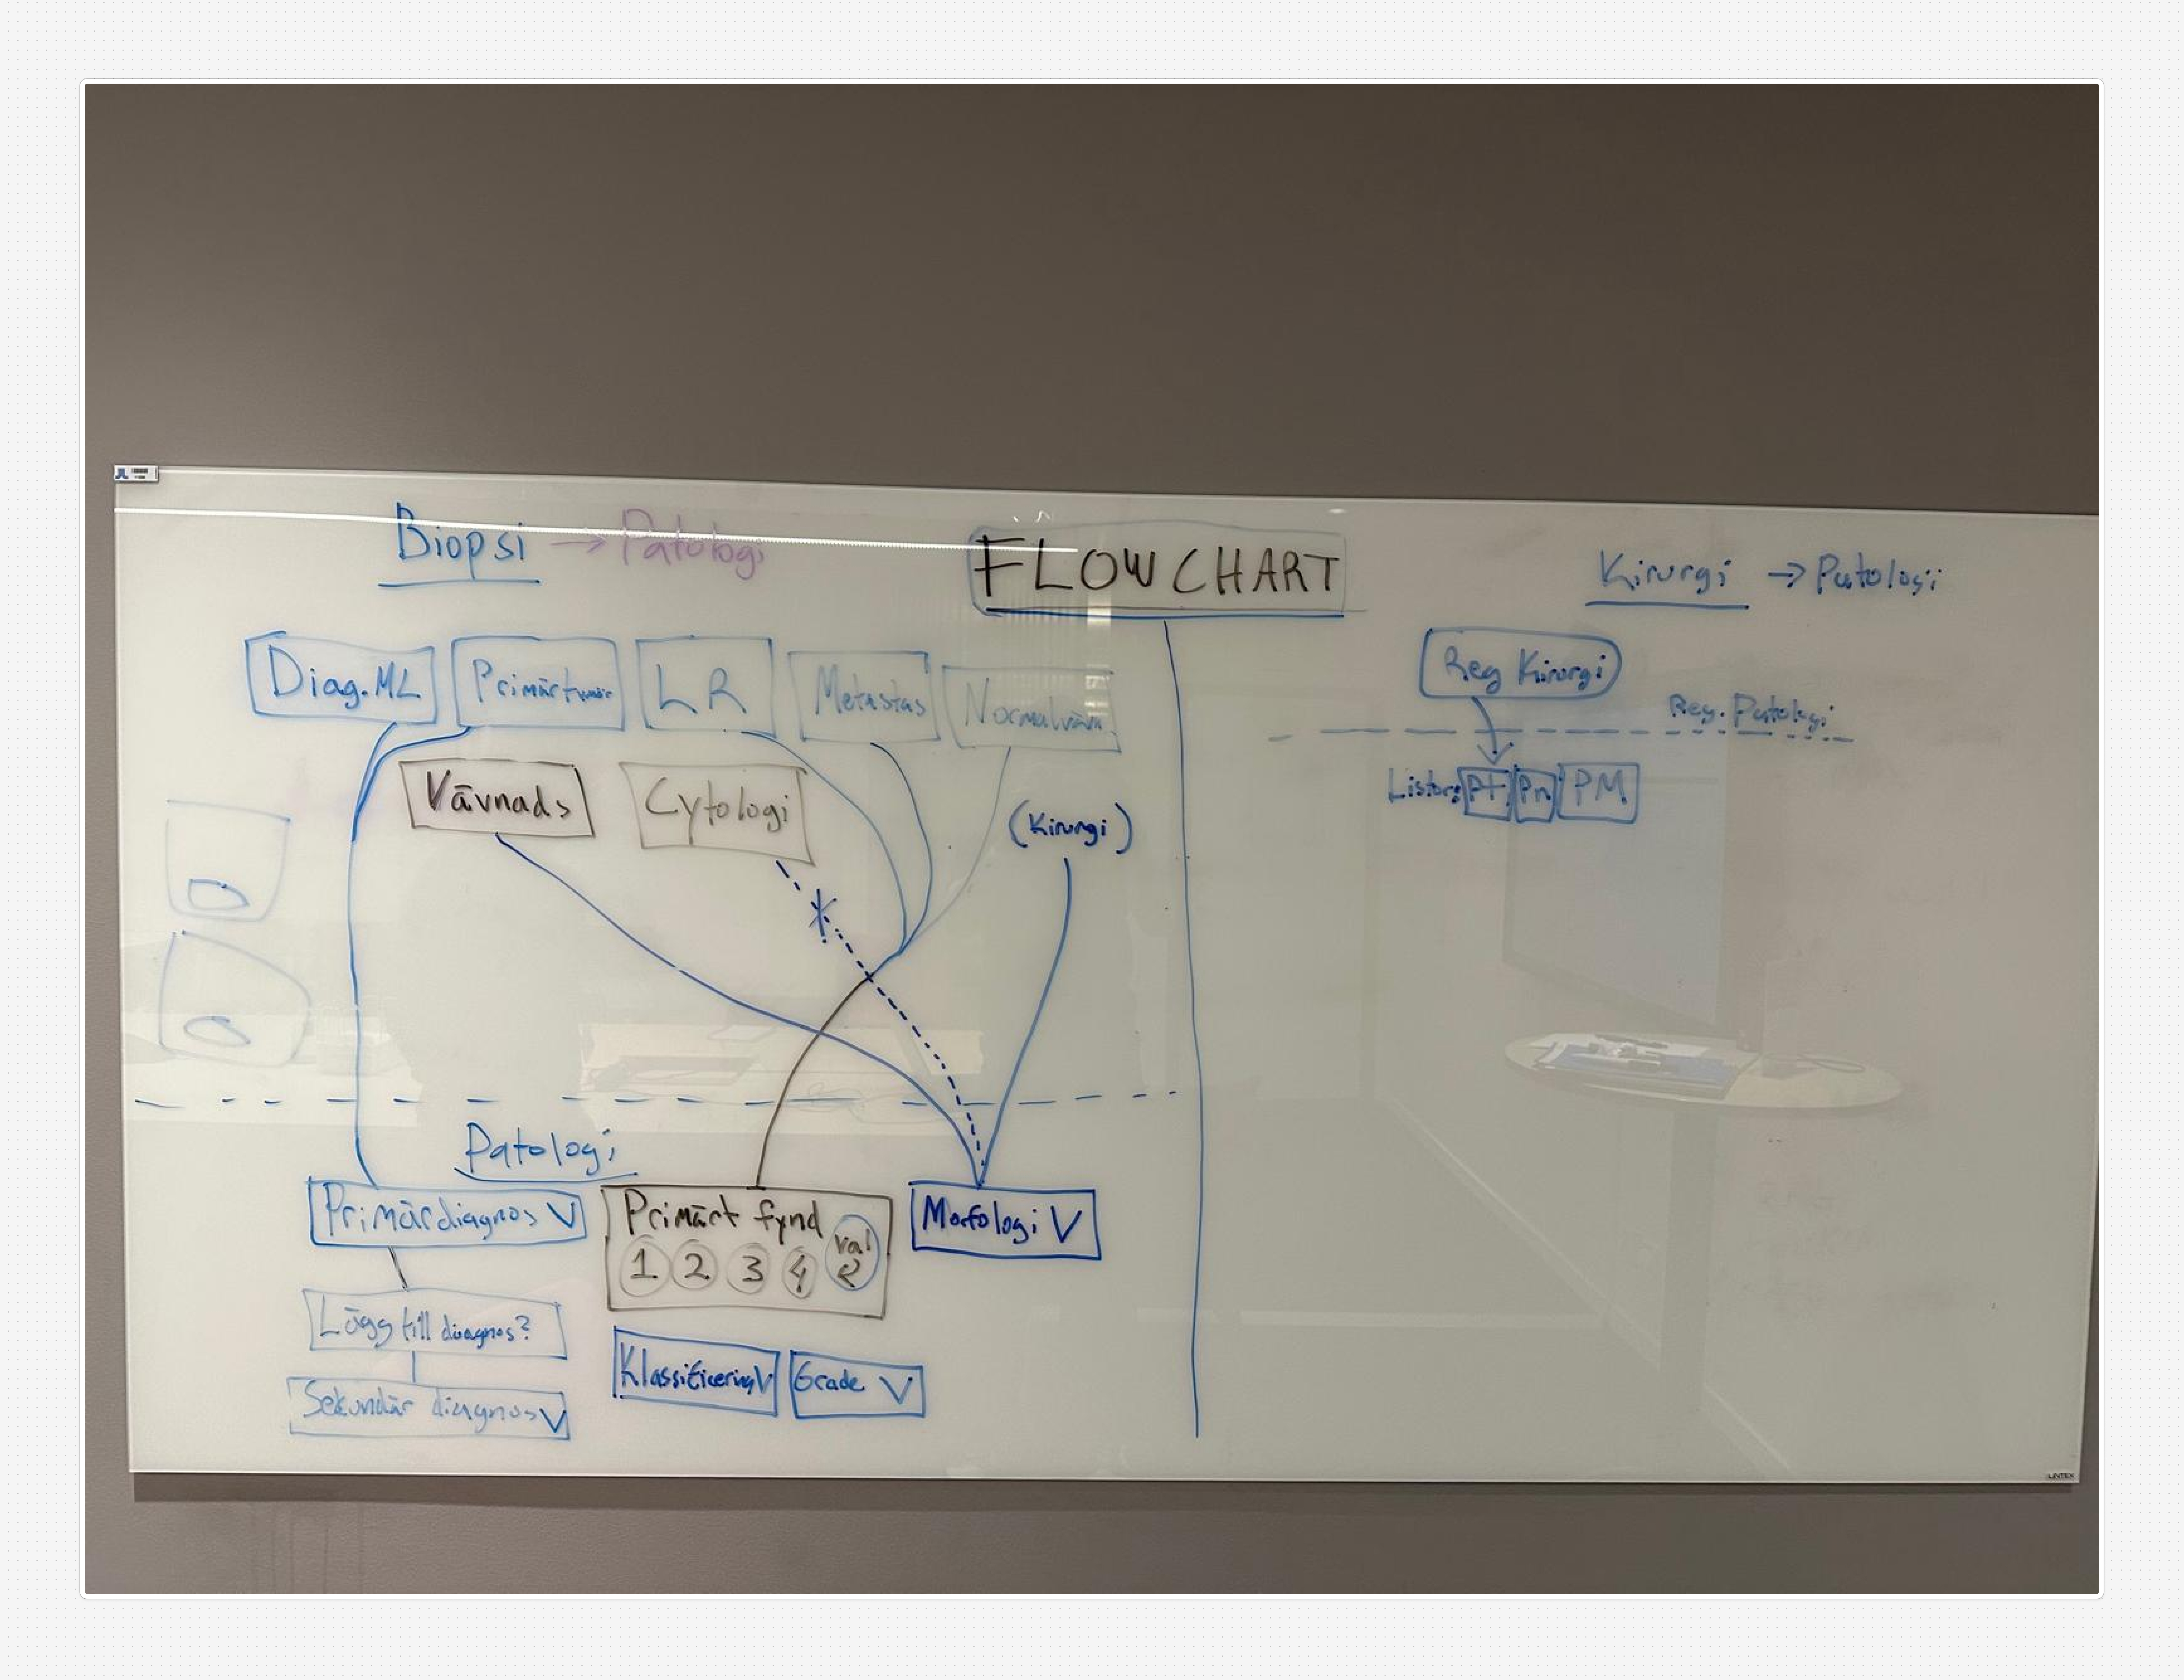
This project demanded a methodology that could handle two distinct layers of complexity simultaneously: the human layer (three professional roles with genuinely different needs) and the technical layer (a variable-driven backend that had to be fully understood before a single screen could be designed).

Rather than moving straight to wireframes, the process started with alignment and comprehension. Every design decision that followed was traceable back to either a user need, a flow, or a variable in the underlying data structure.

01

Stakeholder Alignment

Effect mapping before any design work, establishing a shared understanding of desired outcomes across clinical, administrative, and operational roles.

02

Role-Based Research

Each professional role was mapped independently: workflows, priorities, and pain points, before designing for all three simultaneously.

03

System Comprehension

Deep analysis of the backend variable system before wireframing anything. The interface could only be designed once the underlying data logic was fully understood.

04

Progressive Fidelity

Structural flows → wireframes → high-fidelity prototype → production. Each stage validated something specific before the next began.

05

Role-Structured Testing

User testing sessions built around the priority matrix, surfacing friction specific to each role rather than testing for a generic user.

A system built for one diagnosis at a time — in a world that needed all of them

IPÖ 1.0 was designed diagnosis by diagnosis. Each cancer type had its own separate module. Every time a new diagnosis was added, the interface fractured further. For clinical professionals managing patients across multiple diagnoses, this was not just inconvenient. It was cognitively expensive and operationally risky.

Navigation was inconsistent. Data entry was repetitive. Roles as different as nurses, doctors, and administrators were all funnelled through the same interface with no awareness of who was using it or what they actually needed. The system had grown, but it hadn't scaled.

01

Diagnosis-locked architecture

Every new cancer type required a new module. There was no shared structure, no unified logic. Just accumulation.

02

Fragmented navigation

Users couldn't move fluidly between patient data, diagnostics, and treatments. Each section was its own island.

03

No role awareness

A nurse doing a handover and an administrator tracking outcomes were using the same interface, designed for neither.

04

High cognitive load

Too many clicks, too much noise, too little structure. Professionals were losing time. In clinical care, time matters.

IPÖ 2.0 was commissioned to fix all of this: build a single, unified platform that could handle any diagnosis, serve any clinical role, and grow without becoming harder to use.

The same system, three different hierarchies

Before testing, we mapped what each role actually prioritised when using the system. Not what they said in a survey, but what they needed first, second, and third to do their job well. These priorities varied significantly across roles, and understanding them shaped every user testing session and every design decision that followed.

Doctor
Nurse
Administrator
Priority 1 Overview Navigation Registration
Priority 2 Navigation Registration Navigation
Priority 3 Registration Overview Overview

Priority ranking based on role-specific workflow analysis conducted prior to user testing. This matrix directly informed test scenarios and design focus areas.

Prioritization matrix table with role icons showing priority rankings for Nurse, Doctor, and Administrator across Overview, Navigation, and Registration categories
Prioritization matrix: role-based priority mapping used to structure user testing sessions

What each role actually needed from the system

Role-based priorities only tell half the story. We went deeper, mapping the specific functional and experiential needs behind each priority. What does "navigation" mean for a nurse doing a handover? What does "overview" mean for a doctor preparing for a patient meeting? The answers were different enough to design for separately.

Nurse

Smooth, fast, and trustworthy

  • Fluid navigation between patient records, with no dead ends
  • Fast access to patient data, especially during handovers
  • Clear, unambiguous presentation of current status
  • Confidence that the data shown is up to date
  • Minimum number of clicks to complete routine tasks
Doctor

Structured, precise, clinical

  • A reliable overview to review before patient meetings
  • Fast, accurate data entry without distraction
  • Clinically relevant information, not administrative noise
  • Time-efficient workflows. Every second counts in clinic.
Administrator

Planned, trackable, strategic

  • Tools for capacity planning and resource allocation
  • Outcome tracking across patient cohorts
  • Trend analysis to support clinical and operational decisions
  • Data integrity to support eligibility assessment for studies

Aligning on outcomes before aligning on solutions

Before any user testing began, we created an effect map of IPÖ 1.0. The goal was not to audit what existed, but to surface what different stakeholders expected the system to achieve, and where those expectations diverged or depended on each other.

The exercise brought together operational leaders, clinical coordinators, and the product team. It clarified the system's intended value, mapped the motivations and dependencies behind each role, and gave us a shared vocabulary for the redesign. Without this, any design work would have been solving the wrong problem.

Effect mapping diagram for IPÖ 1.0 showing desired outcomes, motivations, role differences, dependencies, and involvement of operational leaders
Effect map, IPÖ 1.0. Developed collaboratively with operational leaders and clinical stakeholders to establish shared understanding of system value and user motivation before redesign.

The interface was only half the problem — the data structure was the other half

The backend of IPÖ was delivered to us as an Excel document. Hundreds of variables. Each one carrying its own terminology, data type, input constraints, and dependencies. This was the raw material for the entire system. Every field the user would ever see or touch mapped back to a row in that spreadsheet.

We couldn't design for users without first understanding this structure completely. So we read it, mapped it, and manually interpreted how each variable would translate into a UI component: what it looked like, how it behaved, when it appeared, and what it depended on.

Screenshot of the Excel variable sheet containing hundreds of backend variables with terminology, data types, input types, and dependency definitions for the IPÖ system
The variable system delivered in Excel. Each row defines a backend variable with its terminology, data structure, input type, and dependencies.

The translation process followed a deliberate chain. Each step built on the last, and no step could be skipped. Understanding the variable system was not a technical task. It was the foundation for all design decisions that followed.

Variable System
Flowcharts
Design
Interactions

From backend logic to interface behaviour

With the variable system understood, we began mapping flows. First on whiteboards: fast, exploratory, collaborative. We traced how a user would move through the system: what they'd see first, what decisions they'd face, what the system would need to know before showing the next step.

From those sessions we produced digital flowcharts: structured, referenceable, and directly connected to the variable definitions. These became the design's source of truth. Every screen, every interaction, every conditional state traced back to a flow that traced back to a variable.

Whiteboard photo showing hand-drawn flow diagrams mapping user journeys through the IPÖ system, created during collaborative workshop sessions
Whiteboard flows: exploratory mapping sessions with the team
Digital flowchart showing structured user flow mapping for IPÖ 2.0, with conditional logic and variable-connected decision points
Digital flowcharts: structured flows connected to the variable system

Four stages, one continuous thread of logic

The design progression moved in four distinct but connected stages. Each stage validated something specific: structure, logic, detail, or implementation, before the next began. Nothing was decorative. Every decision could be traced back to a user need, a variable, or a flow.

Stage 01
Early low-fidelity wireframe for IPÖ 2.0 showing structural concept and initial layout decisions
Early Wireframe
Structural concept: where things live and why. Fast, disposable, and deliberately rough.
Stage 02
Structured timeline visualisation wireframe showing how patient data and treatment history is displayed chronologically in IPÖ 2.0
Timeline Logic
Refinement of the temporal view: how patient history, treatments, and diagnostics read across time.
Stage 03
High-fidelity interactive prototype of IPÖ 2.0 used in user testing sessions with clinical professionals
Hi-Fidelity Prototype
Full visual resolution for user testing. Close enough to production to surface real friction.
Stage 04
Final production screenshot of IPÖ 2.0 deployed in the Swedish cancer care system
Production
The live implementation. Design decisions validated, backend variables mapped, flows realised.

What changed

IPÖ 2.0 replaced a fragmented, diagnosis-locked system with a unified clinical platform. The outcome was not only a better interface. It was a fundamentally different relationship between the system and its users, and between the system and the organisation that needed to scale it.

Diagnosis-independent architecture

A single unified system now supports all cancer diagnoses without requiring separate modules. Adding a new diagnosis no longer means fragmenting the interface.

Role-aware design

Nurses, doctors, and administrators each encounter a system calibrated to their priorities. The same platform serves three genuinely different workflows.

Reduced cognitive load

Cleaner navigation, fewer steps, and structured information hierarchy meant clinical professionals could focus on patients rather than managing the interface.

Modular, scalable architecture

The new system was built to grow. New features, new diagnoses, new roles can be added without breaking what already exists.

Backend-to-frontend clarity

The translation from the variable system to UI logic was fully documented and traceable. Every design decision had a reason, and that reason could be pointed to in the data structure.

Stakeholder alignment

The effect mapping process brought operational leaders into the design conversation early, ensuring the system delivered value at every level: clinical, administrative, and strategic.